Including This in Any Presentation Will Convince People of Practically ANYTHING


By Max Chang
October 29, 2014
Researchers at Cornell University have some advice for the next time you need to convince anyone of anything: Don’t forget to bring a graph.
A new study conducted by researchers Aner Tal and Brian Wansink found that people are more likely to believe whatever point you are trying make if the presentation has a graph in it, even if it’s information the audience already knows. The study explains that:
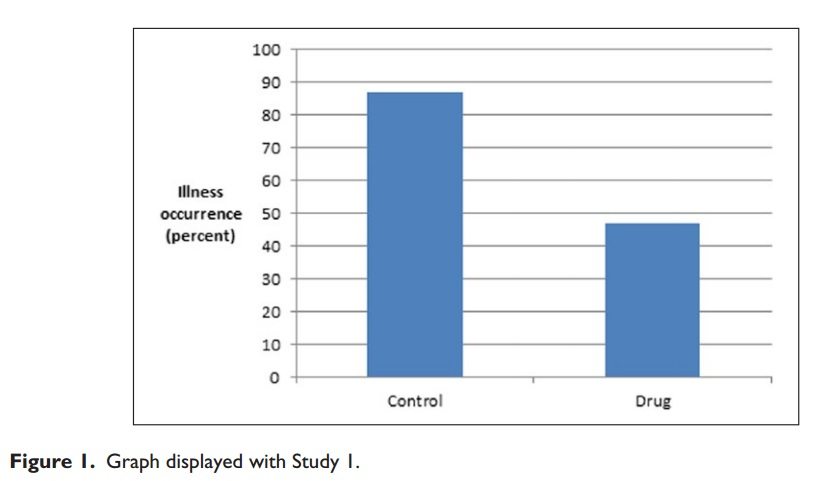
“If a claim ‘looks and smells’ scientific, a person may be inclined to believe it. In other words, communications may be made more convincing without any alteration in content, simply by virtue of being presented with elements associated with science.”
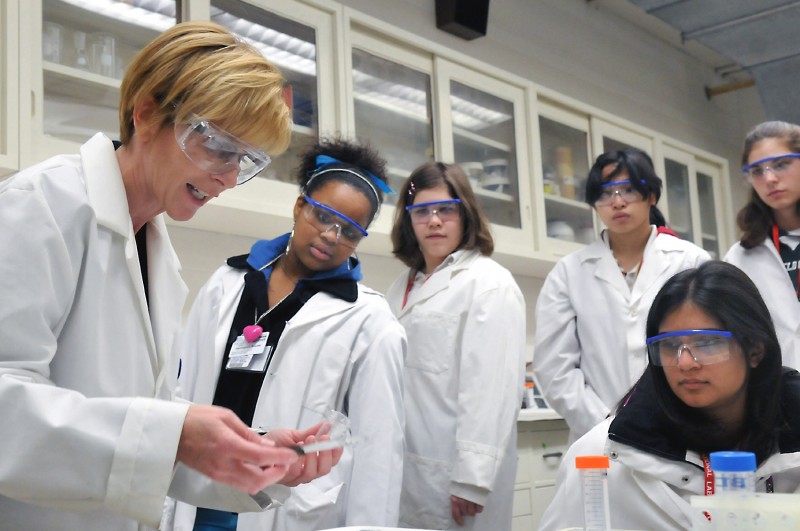
The team discovered their conclusion after testing two groups. Both groups read a prompt about a pharmaceutical company developing a new drug that boosts people’s immune systems to fight the common cold. The controlled first group only read the prompt. The experimental second group saw the prompt and this graph:
The graph only restated what the prompt said but it definitely convinced a lot of people. Only 67 percent of the control group thought that the medication would work, but 96 percent of the experimental group thought that the medication would be effective.
So what does this study teach us?
It turns out that we really respect scientists and their big brains in our society. We’d probably believe anything that comes out of the mouth of someone wearing a white lab coat. Tal and Wansink argue that graphs remind us enough of science-y things that we’ll believe it more often than not. So the next time you have to present in front of investors, don’t forget your graphs.
“Even easily produced, trivial elements that are associated with science, such as graphs, can enhance persuasion. These findings demonstrate that companies can easily abuse the prestige with which science is held.”
Tal and Wansink end their study by saying:
“If in need of further convincing, please refer to our graph (Figure 2).”
This is “Figure 2.”
You have to love scientists with a sense of humor, though I’m not sure I trust them now.
h/t: Business Insider

Share this Article
